Graph Data Modeling for NoSQL and SQL
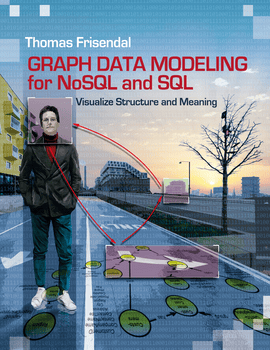
Graph Data Modeling for NoSQL and SQL: Visualize Structure and Meaning, by Thomas Frisendal
Master a graph data modeling technique superior to traditional data modeling for both relational and NoSQL databases (graph, document, key-value, and column), leveraging cognitive psychology to improve big data designs.
Topics
Chapter 1: introduction
1.1. Motivation
1.2. Audience
1.3. Outline
1.4. Acknowledgments
Chapter 2: why model?
2.1. Model what?
2.2. Providing business value from big data and NoSQL
2.3. Data modeling heritage
2.3.1. Evolution of database
2.3.2. Pointer database (dbomp)
2.3.3. Hierarchical workhorses
2.3.4. Programmer as navigator
2.3.5. Chen, entities, attributes and relationships
2.3.6. Relational model
2.3.7. The great database war of the eighties
2.3.8. Objects galore!
2.3.9. Graph models
2.3.10. Object role model (orm) and fact modeling
2.3.11. New keys in the models
2.3.12. Data modeling conclusions
2.4. Perception, cognition and psychology
2.4.1. Perception and cognition
2.4.2. Concept maps
2.4.3. Conceptual spaces
2.4.4. Knowledge graphs
2.4.5. Cognitive computing example: saffron
2.4.6. Ubiquitous pointer
2.4.7. Think spatially
Chapter 3: real requirements of data modeling
3.1. Post-relational data modeling
3.2. Finding meaning and structure
3.2.1. Working with business people
3.2.2. Concept models as part of user stories
3.2.3. Functional dependency profiling
3.2.4. Mining the semantics
3.3. Visualization of models
3.3.1. Functional dependency visualization
3.3.2. Understanding structure and content
3.3.3. Property graphs
3.3.4. Progressive visualization of data models
3.3.5. Tool support for property graphs
3.3.5.1 white-boarding on tablets
3.3.5.2 diagramming tools
3.3.5.3 cmaptools
3.3.5.4 graph database browsers
3.3.5.5 graph visualization tools
3.4. Data modeling requirements
3.4.1. Solution architecture
3.4.2. Business concept model requirements
3.4.3. Solution data model requirements
3.4.4. On using property graphs
3.4.5. Physical data model requirements
3.4.6. Keeping it simple
Chapter 4: data modeling described
4.1. Solution modeling (solution model)
4.1.1. Business concept model
4.1.2. Power of dependencies
4.1.3. Names matter
4.1.4. Finding patterns
4.1.5. Cardinality and optionality
4.1.6. Housekeeping
4.1.7. Modeling the subject area overview
4.1.8. Data types
4.1.9. Identifiers, keys, and pointers
4.1.10. Keys
4.1.11. Handling time
4.1.12. Design involves decisions
4.1.13. Abstraction, specialization, and generalization
4.1.14. Unusual concepts
4.2. Transform, optimize, and deploy (physical model)
4.2.1. Creating the physical models
4.2.2. Denormalize with a smile
4.2.3. Key / value targets
4.2.4. Document stores
4.2.5. Rdf and triplestores
4.2.6. Property graphs
4.2.7. Multidimensional models
4.2.8. SQL targets
Chapter 5: selected detailed examples
5.1. From relational model to property graph model
5.2. A multidimensional model
5.3. A survey form
5.4. Fibo indices and indicators model
Chapter 6: before your expedition begins
6.1. Essential skills and insights for your “expeditions”
From Karen Lopez’s Foreword:
In this book, Thomas Frisendal raises important questions about the continued usefulness of traditional data modeling notations and approaches:
- Are Entity Relationship Diagrams (ERDs) relevant to analytical data requirements?
- Are ERDs relevant in the new world of Big Data?
- Are ERDs still the best way to work with business users to understand their needs?
- Are Logical and Physical Data Models too closely coupled?
- Are we correct in using the same notations for communicating with business users and developers?
- Should we refine our existing notations and tools to meet these new needs, or should we start again from a blank page?
- What new notations and approaches will we need?
- How will we use those to build enterprise database systems?
Frisendal takes us through the history of data modeling, enterprise data models and traditional modeling methods. He points out, quite contentiously, where he feels we have gone wrong and in a few places where we got it right. He then maps out the psychology of meaning and context, while identifying important issues about where data modeling may or may not fit in business modeling. The main subject of this work is a proposal for a new exploration-driven modeling approach and new modeling notations for business concept models, business solutions models, and physical data models with examples on how to leverage those for implementing into any target database or datastore. These new notations are based on a property graph approach to modeling data.
From the author’s introduction:
This book proposes a new approach to data modeling-one that “turns the inside out”. For well over thirty years, relational modeling and normalization was the name of the game. One can ask that if normalization was the answer, what was the problem? There is something upside-down in that approach, as we will see in this book.
Data analysis (modeling) is much like exploration. Almost literally. The data modeler wanders around searching for structure and content. It requires perception and cognitive skills, supported by intuition (a psychological phenomenon), that together determine how well the landscape of business semantics is mapped.
Mapping is what we do; we explore the unknowns, draw the maps and post the “Here be Dragons” warnings. Of course there are technical skills involved, and surprisingly, the most important ones come from psychology and visualization (again perception and cognition) rather than pure mathematical ability.
Two compelling events make a paradigm shift in data modeling possible, and also necessary:
- The advances in applied cognitive psychology address the needs for proper contextual framework and for better communication, also in data modeling, and
- The rapid intake of non-relational technologies (Big Data and NoSQL).
About Thomas
Thomas Frisendal is an experienced database consultant with more than 30 years on the IT vendor side and as an independent consultant. He has worked with databases and data modeling since the late 70s; since 1995 primarily on data warehouse projects. His area of excellence lies within the art of turning data into information and knowledge. Since 2005 he has specialized in business analysis, concept “harvesting” and mapping, modeling of information and data as well as design of analytical solutions. His approach to information-driven analysis and design is “New Nordic” in the sense that it represents the traditional Nordic values such as superior quality, functionality, reliability and innovation by new ways of communicating the structure and meaning of the business context. Thomas is an active writer and speaker, and at the time of writing also Chief Data Warehouse Architect at SimCorp. Thomas lives in Copenhagen, Denmark.
Faculty may request complimentary digital desk copies
Please complete all fields.
